Showing posts with label JBoss. Show all posts

Thursday, March 29, 2018

Small helper for Mac OS/X to open Jira items

In our Kiali project we develop at GitHub, but have the issue tracker on a Jira instance.

Developers put the jira ticket number into commit comments and pull-request headers. To see the Jira item I had so far to go to the Safari url bar and type in the issue link. Sometimes there was a different item already in the history, so I only had to change the key. But all in all that was tedious.

Luckily OS/X has tools like Automator, that allow to create your own services.

I launched Automator and selected to create a service. For details about this see this article.

I then put a "Execute AppleScript" action into the Automator workflow

automator workflow

Saving this whole workflow under "Open in JBoss Jira" then makes the service immediately available

So I can now select a Jira-key and do right-click to get the service

My service in the service context menu

Obviously the service is very much tailored to my need, so I'll put the AppleScript here so you can copy & modify it to your needs.

on run {input, parameters}
	set target to "https://issues.jboss.org/browse/" & (input as string)
	tell application "Safari"
		activate
		tell window 1
			set current tab to (make new tab with properties {URL:target})
		end tell
	end tell
end run

[ UPDATE ]
My colleague Max Andersen pointed out an even better way of doing this by having some helpers turn those keys into links that can directly be clicked.

Monday, December 05, 2016

Hawkular at GrafanaCon

Grafanacon logo finalI had the pleasure to be invited to present the Hawkular eco-system at GrafanaCon 2016.

The venue for this 2-day conference was certainly not your everyday conference venue in a hotel ballroom or cinema, but a lot more heavy-metal:

And thus the sessions of the first day all happened in the on-board theatre which used to be one of the elevators that moved the aircrafts from the hangar to the flight deck.

IMG 20161130 092133
Former aircraft elevator

The sessions were kicked off by Torkel Odegaard, the creator of Grafana by giving some numbers about the growth and versions of Grafana and the community of users and contributors.

In the next session Kevin from Fermilab talked about lasers and how they are connected to Grafana (hint: monitoring of the huge infrastructure that monitors the collider experiments).

And then next was something that probably most have been waiting for: the official launch of Grafana 4 by Torkel. This included a demonstration of some new features like Alerting, where you can define alerts directly on a graph including a visual value-picker and a simulation mode. The announcements continued later by announcing the renaming of Raintank to GrafanaLabs and the completion of the Stack with Intel Snap, which was announcing its version 1.0 followed by Graphite doing the same

I am not going through all the sessions here, but still want to mention the presentation of Kyle Brandt, creator of Bosun alert engine. His talk was less of a product presentation, but rather a philosophical one on getting the communication right. If one engineer sets up an alert trigger and another one has to work on the fired alert, it is important that the later gets enough context to be able to quickly react to the alert.

The afterparty in the evening happened in a nearby bowling place. Those balls are a lot larger and heavier than those we use in Germany for Kegeln.

Intrepid by night

The second day had a format with 2 parallel sessions, which was a lot more "how-to" like, which included a good presentation by Brian Brazil of Promtheus fame and a nice (hi)story of monitoring at Sony PlayStation. My talk took place on the afternoon at 3pm. It went well and I got some good questions and feedback.

As this was the first day with better weather I also toured the flight deck and the bridge of the Intrepid

IMG 20161201 121049
Bridge of the Intrepid

IMG 20161201 121905
Lockheed A1

IMG 20161201 123151
Space Shuttle Enterprise

IMG 20161201 125541
View from the bridge

All talks were recorded and will be pushed online once the video team has edited in the slides. My Slides are available in the meantime from http://www.pilhuhn.de/GrafanaCon2016.pdf. I will update this post once the recordings are online.

Tuesday, October 18, 2016

A DSL for Alert Trigger Definitions in Hawkular

Hawkular had for a while a UI with the possibility to set up Alert Triggers. As the name suggests are those triggers used to define conditions when an Alert is to be fired.

Since a while there is now the ManageIQ UI that allows to set up such triggers. And also Hawkular APM is now able to forward data into Alerting.

The other day I was doing some testing and a colleague asked me if I had already defined some triggers. I thought that I neither want to log into ManageIQ right now nor pass JSON structures via curl commands.

As I did some DSL work for metrics recently, I thought, why not set up a DSL for trigger definitions. This is work in progress right now and here are two examples

Set up a threshold trigger to fire when the value of _myvalue_ is > 3:

define trigger "MyTrigger"
 enabled
 ( threshold "myvalue" > 3 )
 auto-disable

Set up a trigger on availability when it is reported as DOWN. The trigger is not enabled.

define trigger "MyTrigger"
  ( availability "mymetric" is DOWN )

As with my metric DSL I am implementing this in Ruby with the help of Treetop. And likewise I am integrating this in HawkFX.

Inserting a definition

At the moment it is a very crude integration via entry points in the main menu. And the DSL itself is also far from ready. I consider this an experimentation space. If it turns our successful, it may be possible to take the grammar and directly integrate it into Hawkular-Alerts, so that one can directly POST a document with a DSL fragment, which then gets turned into the internal representation.

If you are looking for code, this is available in the alert_insert branch of HawkFX.

Tuesday, September 27, 2016

Computed metrics for HawkFX (updated)

Computed metrics are something I wanted to do for a very long time, already in RHQ, but never really got around it and sort of forgot about it again.

Lately I found a post that contained a DSL to do exactly this (actually you should read that post not because of the DSL, but because of the idea behind it).

After seeing this, I got the idea on what to do and to include this in HawkFX, my pet project, which is an explorer for Hawkular.

HawkFX screen shot
HawkFx with the input window for formulae, that shows a formula and also a parser error.
The orange chart shows Non-Heap used, the redish one the heap usage of a JVM.

Formulae

Formulas are in a DSL that looks a bit like UPN, e.g. as in the following (I've shortened the metric ID for readability, more on them below):

(+ metric( "MI~...Heap Used" , "max")
   metric( "MI~...NonHeap Used", "max"))

to sum up two metrics (see also screenshot below). The 'metric' element gets two parameters, the metric id and also which of the aggregates that the server sends should be taken (in this case the max value) - this comes from the fact that we request the values to be put into 120 buckets by the server.

Or if you have the total amount of memory you could also subtract the used memory to get a graph of the remaining:

(- 1000000 metric( "MI~...NonHeap Used", "max"))

You could also get the total wait time for responses at a point in time when you multiply the average wait time with the number of visitors:

(* metric("MI~..ResponseTime","avg")
   metric("MI~..NumberVisitors","sum"))

Computed total memory usage

Summing up the metrics for 'Heap Used' and 'NonHeap Used' as shown above would then give you a nice graph of the total memory consumption of a JVM:

Chart with computed metric
The green chart now shows to combined memory usage of Heap and Non-Heap, which is computed from the other two series. Orange and red are as above.

On metric IDs

Metric IDs are the IDs under which a metric is stored inside of Hawkular. The example here comes from an installation of Hawkular-services in Docker. If you just feed your metrics into Hawkular metrics, the IDs will looks like the ones you are using.

ID and path field
ID (upper) and path fields (lower) for a selected item in the tree

I have just pushed an update to HawkFX that provides the ID and path in their own fields at the bottom of the main window, so you can copy&paste them.

Future

I will talk more about the parser in an upcoming article. For now it is a personal playground to also better understand what is doable here. If this turns out to be successful I can imagine that the DSL could directly be incorporated into Hawkular-metrics so that the rules are available to all metrics clients.

It would of course be cool to have an editor for the formulas that allows to interactively pick metric IDs etc, but I doubt that I will get to this any time soon.

Monday, June 27, 2016

Using Hawkular-services via Docker [updated x3]

As you may know, we have started to create the Hawkular-Services distribution, which we try to build weekly. This distribution comes without embedded Cassandra, with no default user and also without a UI (we plan on re-adding a basic UI).

But you must not fear.

Running Hawkular-services is pretty easy via Docker.

The scenario

Let me start with a drawing of what I want to do here:

Hawk service via docker
Setup of Hawkular-services via Docker

In this scenario I run a Docker daemon (which is extremely easy these days on a Mac thanks to DockerForMac (Beta)). On the daemon I run a Hawkular-services container, which talks to a Cassandra container over the Docker-internal network. On top of that I have two WildFly10 containers running ("HawkFly"), which have been instrumented with the Hawkular-agent.

Running

For the purpose to setup linking and data volumes I am using docker-compose. The following is the docker-compose.yml file used (for the moment all images are on my personal account):

# set up the wildfly with embedded hawkular-agent
hawkfly:
  image: "pilhuhn/hawkfly:latest"
  ports:
    - "8081:8080"
  links:
    - hawkular
# The hawkular-server
hawkular:
  image: "pilhuhn/hawkular-services:latest"
  ports:
    - "8080:8080"
    - "8443:8443"
    - "9990:9990"
  volumes:
    - /tmp/opt/data:/opt/data
  links:
    - myCassandra
  environment:
    - HAWKULAR_BACKEND=remote
    - CASSANDRA_NODES=myCassandra
# The used Cassandra container
myCassandra:
  image: cassandra:3.7
  environment:
    - CASSANDRA_START_RPC=true
  volumes:
    - /tmp/opt/data:/opt/data

To get started save the file as docker-compose.yml and then run:

$ docker-compose up hawkular
This starts first the Cassandra container and then the Hawkular one. If they do not yet exist on the system, they are pulled from DockerHub.

After Hawkular has started you can also start the HawkFly:

$ docker-compose up hawkfly

Update

Right now if you would directly do docker-compose up hawkfly the agent would not work as the hawkular server is not yet up and the agent would just stop. We will add some re-try logic to the agent pretty soon.

I have pushed a new version 0.19.2 of HawkFly that has the retry mechanism. Now it is possible to get the full combo going by only running

$ docker-compose up hawkfly

Running without docker-compose

On my RHEL 7 box, there is Docker support, but no docker-compose available. Luckily docker-compose is more or less a wrapper around individual docker commands. The following would be a sequence that gets me going (you have to be root to do this):

mkdir -p  /var/run/hawkular/cassandra
mkdir -p  /var/run/hawkular/hawkular
chcon -Rt svirt_sandbox_file_t /var/run/hawkular

docker run --detach --name myCassandra -e CASSANDRA_START_RPC=true \
    -v /var/run/hawkular/cassandra:/var/lib/cassandra cassandra:3.7

sleep 10

docker run --detach -v /var/run/hawkular/hawkular:/opt/data \
  -e HAWKULAR_BACKEND=remote -e CASSANDRA_NODES=myCassandra \
  -p 8080:8080 -p 8443:8443 --link myCassandra:myCassandra \
  pilhuhn/hawkular-services:latest

Looking forward

There is an open Pull-Request to the Hawkular-Services Docker build as a part of a release and make it available via DockerHub on the official Hawkular account.

With this PR you can do

$ mvn install
$ cd docker-dist
$ mvn docker:build docker:start

to get your own container built and run together with the C* one.

Open questions

Right now I put in the default user/password and if the agent inside the hawkular-container should be enabled at image build time. Going forward we need to find a way to pass those at the time of the first start. The same applies (probably even more) to SSL-Certificates.

Storing them inside the container itself does not work going forward, as this way they are lost when a newer version of the image is pulled and a new container is constructed from the newer image.

Monday, May 09, 2016

Introducing HawkFX

As I said before, I started playing with JRubyFX. And for me learning something new best works with a use case, so I started creating an inventory browser for Hawkular.

Why JRubyFX?

Let's first start with "What is JRubyFX" anyway? JRubyFX is JavaFX brought to the Ruby world by the means of JRuby. This means that you can implement UIs with the help of the JavaFX framework and use its components and tools to build the UI. The difference to plain JavaFX is though that all the implementation code is written in Ruby and run by JRuby on the JVM.

I was doing a bit of JavaFX in the past and I wanted to generate a standalone inventory browser for Hawkular. Now that I have been working with Ruby lately and we already have the Hawkular client gem, I thought I'd give JRubyFX a try.

And I have to say this is pretty cool.

Some screenshots

login screen
Login screen
Main screen with chart
Main screen with inventory browser (left) and metric chart

The main screen shows a tree view on the left that displays the feeds as top level elements. Opening a feed will show recursively the resources and metrics. Clicking on a metric gets it charted on the right side.

Alerts and Events
Alert and Event list

A menu item in the main screen opens the alerts browser that allows to peek at alerts and events in the system.

Like in the main screen, there is a context menu that will allow to view the raw object as shown below:

Raw event display
Raw display of an event

Custom components

The time range picker on the main screen and alert screen is a custom component, that was implemented once with a .fxml file and some Ruby code:

class TimePicker < Java::javafx::scene::layout::HBox
  include JRubyFX::Controller

  fxml 'TimePicker.fxml'

  def initialize(caller, callback)
[..]
end

Including it is pretty simple too:

    box = find '#alertEventTopBox'
    box.children.add time_picker(self, :set_time_range)

In the first line we find the HBox to add the picker and then just add it to the children of the box. Done.

Running and code

HawkFX is available on my GitHub account at https://github.com/pilhuhn/hawkfx. To run the tool you need JRuby 9

If you are using rvm you can select it via

rvm use jruby-9.0.5.0

install and use bundler to install the required gems

gem install bundler bundle install

then run

jruby hawkfx.rb

Enjoy! :-)

Tuesday, May 03, 2016

Presenting at ManageIQ Design Summit 2016

I have the luck to go to the ManageIQ Design Summit 2016 in Mahwah, New Jersey at the beginning of June. And not only that, but also to be able to present there (more about this in a moment).

You may be looking at the web site of ManageIQ or the Design summit and think "why the heck is the Java and JBoss guy talking at a Ruby conference"? And the answer is simple:

Hawkular and ManageIQ are collaborating on the future of Middleware management.

And so I will talk about "Adding middleware to the game", describing the current state of Red Hat middleware and monitoring with RHQ and Hawkular, the integration with ManageIQ that we are already working on. And also the path and vision going forward.

ManageIQ has all the knowledge about the operating system and infrastructure the Middleware servers are running on, where Hawkular only provides some basic information. ManageIQ on the other hand has no notion of applications yet, wich is the domain of Hawkular. ManageIQ can also be used to provision new VMs and containers with Middleware in them, which can then be monitored and managed by Hawkular.

If you are close by, join me :)

NB: while I am there I will try find some of the nearby Geocaches, as New Jersey is still missing on my list (as so many other states in he US :)

Saturday, April 23, 2016

Welcome GSoC 2016 Students to JBoss

JBoss.Org has the luck of being selected as one of the mentoring organizations for this years issue of Google Summer of Code.

On Friday April 22nd, Google has announced the 10 students that will all work with JBoss. Those students with their project are:

  • Idel Pivnitskiy: AeroGear WebPush and UnifiedPush Server integration
  • rohitmohan96: Ceylon Markdown
  • Lucas Werkmeister: Ceylon TypeScript Loader
  • Samuel Richardson: Drools Rules in Minecraft
  • Anton Gabov: Smart HTTP/2-based protocol for Infinispan
  • Austin Ko: Hawkular-agent For Vert.x
  • mincongh: Hibernate Search: JSR 352 batch job for re-indexing entities
  • Anuj Garg: Improve existing Android client of Hawkular
  • Tugba: Teiid HDFS Translator/Connector
  • dimcho: Test scheduling for large test suites

We also want to thank all the other students for their in total over 70 proposals that they have submitted.

See also the GSoC project page for more details and the announcement post from Google for further information.

Thursday, March 17, 2016

Reacting on IoT data with Hawkular

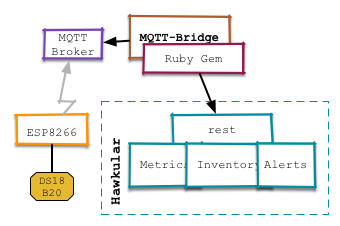
In the first post I have been talking about how send IoT sensor data to the metrics subsystem of Hawkular and then how to register the metric in Hawkular so that it can be graphed in the console.

In this article I will talk about how the Hawkular alerts component (that is already available in Hawkular-full) can be used to react on incoming data and make an LED on an Arduino blink.

DSC 0160
Arduino Uno with Ethernet shield and yellow LED

For the Arduino I have added a cheap Enc28j60 based Ethernet shield. There is a standard library available, that allows to easily set up a web server, which we are using (in fact the code is mostly from that example).

The new (full) setup is like this:

Hawk alert
Setup with Arduino as actor

Alerting

Hawkular already has an alerting component built in, that allows to compare incoming values with thresholds and then invoke plugins to forward the fired alert via email, to irc channels and many more way of communication. The plugin we are going to use here is the webhook one. As in the standard Hawkular distribution only the email plugin is present we will need to install the webhook plugin first:

Check out Hawkular-alerts

git clone https://github.com/hawkular/hawkular-alerts.git
cd hawkular-alerts

Build hawkular alerts :

mvn -Pdev -DskipTests install

Now you can copy the plugin to the Hawkular-server

cd hawkular-alerts-actions-plugins
cd hawkular-alerts-actions-webhook
cp hawkular-alerts-actions-webhook.war \
   $HAWKULAR/modules/system/layers/hawkular/org/hawkular/nest/main/deployments/

As Hawkular does not pick this up automatically you need to restart the Hawkular server after copying the webhook.war over.

Set up alerting

I have modified the ruby script to pull in a configuration file (in YAML format):

---
16617927:40.176.91.120.5.0.0.125:
  :name: Living room
  :alert:
    :comparator: :gt
    :value: 25
The first line is the id of the metric to which the following lines apply to. Second line is the display name for the UI. The next section then sets up alerting.

Let's have a look how this looks in code (you can see the full code on GitHub)

Register the webhook to be used below:

@webhook_props = { url: 'http://172.31.7.177/',   # target server
                   method: 'POST' }               # http verb
@alerts_client.create_action 'webhook', "send-via-webhook-#{metric_id}", @webhook_props

Set up a trigger and a condition, trigger first

  t = Hawkular::Alerts::Trigger.new({})
  t.enabled = true
  t.id = "trigger_#{metric_id}"
  t.tags = { :resourceId => "#{feed}/#{res_id}" }
The tags tell the UI on which resource the Trigger applies and thus enables showing the alert in the Hawkular UI

Next the condition:

  c = Hawkular::Alerts::Trigger::Condition.new({})
  c.trigger_mode = :FIRING
  c.type = :THRESHOLD
  c.data_id = metric_id
  c.operator = alert[:comparator].to_s.upcase
  c.threshold = alert[:value]

And then finally as we do not only want the alert to show in the UI, but also be forwarded to our Arduino with the webhook, we need to attach the webhook to the Trigger. Plugin id is webhook and the action_id is what we have set up above.

  # Reference an action definition
  a = Hawkular::Alerts::Trigger::Action.new({})
  a.action_plugin = 'webhook'
  a.action_id = "send-via-webhook-#{metric_id}"
  t.actions.push a
And then we can create the trigger, which will be active immediately.

  @alerts_client.create_trigger t, [c], nil

Fire away

Now when a value above the threshold comes in, the webhook will be triggered, it will open a http connection to the Arduino and the LED will blink.

In addition the alert will also be shown in the Alert Center in the Hawkular UI:

Bildschirmfoto 2016 03 17 um 16 32 37
List of high temperature alerts in the alert center.
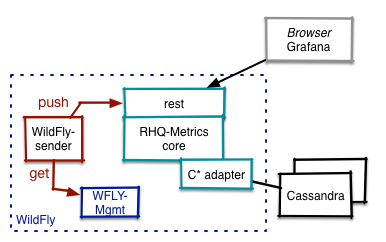
More

Note that the above trigger definition is pretty simple and only has one comparator. Also the trigger fires each time a value above the threshold comes in. In a more real world scenario one would add some dampening that the trigger only fires when the measurement is a few times over the threshold for some interval. Or if you start your air-conditioning, you would set the trigger to auto-disable and then have a comparator to switch it back on after the temperature has fallen below a certain level.

There is even a lot more you can do with Hawkular Alerts past the above, including standalone deployment for embedding it in your own application.

Some further reading:

Hawkular Alerts for Developers -- pretty comprehensive documentation of Hawkular Alerts.
Introduction to AutoResolve triggers
Using Hawkular Alerts as a standalone engine

Wednesday, March 02, 2016

Send IoT data to Hawkular-full

In a previous blog post, I was talking about how to send IoT sensor data to Hawkular-metrics.

While this already works quite well, it also lacks the integration with other parts of Hawkular, namely Inventory and Alerting.

In this blog post I will talk about integration with Inventory and how to view the data in the Hawkular-UI. An upcoming article will then talk about Alerting.

I have modified the setup from the last post a bit:

Bridge arch
New setup with a Ruby client

Instead of PTrans I've written a small Ruby client, that makes use of the Hawkular-Client-Ruby ruby gem (it needs version 0.2.1, that has not yet been published to RubyGems.org. In addition it uses a MQTT gem, which makes the code pretty short.

The Ruby client MQTT-bridge now listens on /hawkular/+ topics. Metric arriving on /hawkular/metrics are forwarded as such and registration messages on /hawkular/register are used to register the external resource like the ESP8622 micro controller in Hawkular inventory.

The following is an example registration message:

{"feed": "esp16617927",
  "rt":"esp8266",
  "r":"mcu16617927",
  "mt":{
    "id":"thermo",
    "unit":"NONE",
    "type":"GAUGE",
    "collectionInterval":0
  },
  "m":{
    "id":"16617927:40.176.91.120.5.0.0.125",
    "mt":"thermo",
    "na":"thermo_40.176.91.120.5.0.0.125",
  }
}

You can get the client from https://github.com/pilhuhn/hawkular-mqtt-bridge and then easily run it via

$ ruby lib/hawk.rb

If you are not using a Hawkular-Server on localhost with default user, then you first need to modify the ruby code at the top.

The client will connect to the Hawkular server and then wait for messages on the MQTT topics.

The client code is still rather simplistic and does not spool data when the target Hawkular server is down.

UI

Since Hawkular 1 Alpha11 we have an Explorer (as easter egg :-) that allows to browse through inventory and to show resources and their metrics. The following shows the explorer with a chart from the thermo sensor for the last 12h.

Hawkular screenshot with chart data from thermo sensor
Hawkular UI with chart of sensor data from last 12h

The chart shows a peak at 1am - I have no idea why it is there. Possibly one of my cats examined the sensor :)

ESP Sample code

I have also provided a sample Lua script, that can be used on a ESP8266 like the Adafruit Huzzah shown in the previous post.

As the stock Huzzah comes with NodeMCU Lua 0.9.5 which was not working well for me, I have flashed it with a newer version of NodeMCU Lua. This is now running a firmware with the following modules:

NodeMCU custom build by frightanic.com
	branch: master
	commit: c8037568571edb5c568c2f8231e4f8ce0683b883
	SSL: false
	modules: cjson,file,gpio,i2c,mqtt,net,node,ow,rtcmem,rtctime,sntp,tmr,uart,wifi,ws2812
 build 	built on: 2016-02-18 08:33

Alerting?

In an upcoming post I will talk about alerting in Hawkular to act on unusually high or low temperatures.

Thursday, February 11, 2016

Sending IoT sensor data to Hawkular-Metrics via MQTT

The other day I was writing about 'RHQ-Metrics and Grafana' and was describing how you can incorporate data from other system management agents.

Fast forward a bit and Raider is now called Twix and RHQ-Metrics has morphed to Hawkular-Metrics under the Hawkular.org umbrella.

Recently I have also been playing with Arduino and Co. and got myself also an Adafruit Huzzah ESP8266 board. This is a breakout board with the ESP8266 microprocessor on, that has a bunch of IO pins and built-in WiFi. With the default firmware it is programmed in Lua.

Huzzah on Breakout board
Huzzah on breakout board

While one can program the ESP from the Arduino IDE, I thought to give Lua a try (also to get a feel for the difference to the WiPy, that also comes with Python as a high level language). What is nice with the ESP and the NodeMCU firmware is that it already comes with support for networking, 1-wire, MQTT and more out of the box.

To get started I took the hello-world of IoT-sensors and hooked up a DS18B20 OneWire thermo sensor (for those old enough, I did that in the past with RHQ) up to the ESP and then have this communicate to a MQTT Broker (mosquitto).

Hawkular Metrics IOT
Setup diagram

As said before we have with Ptrans a universal protocol translator that can be used to feed data from collected, ganglia and others into Hawkular-Metrics. I've taken that and added support for MQTT (in my personal repo for now). Ptrans will now connect to a broker and listen on the '/hawkular/metrics' topic for data that needs to be in graphite format like

path value [timestamp_in_s]

The timestamp is optional, as in my case I was not able to get any real time clock data from the micro controller (there seem to be variants that have a clock on board).

To see the data that is coming from the device I can just run

$ mosquitto_sub  -t /hawkular/+
16617927:40.176.91.120.5.0.0.125 24.625
16617927:40.176.91.120.5.0.0.125 23.9375
16617927:40.176.91.120.5.0.0.125 23.8750

So here NodMCU with ID 16617927 and thermo sensor 40.176.91.120.5.0.0.125 is reporting around 24 deg Celsius.

I will post more on the topic in a laster posting.

References:

Tuesday, July 07, 2015

Running OkHttpClient from within WildFly 9 (subsystem)

A few days ago WildFly 9 was released and one of the highlight for sure is the support of HTTP/2.0 in the Undertow web subsystem. As Hawkular has recently moved to use WildFly 9 (from 8.2) as its underlying server, it was sort of natural to try to use http2 for connections from the Hawkular-Wildfly-Monitor client to the server.

One peculiarity here is that in my case the monitor client is running inside the Hawkular server, but at the end it does not matter if it is running inside a standalone WildFly server or inside the Hawkular server.

The setup

Greg Autric has written a blog post, that shows how to set up Http2 in WildFly with the offline CLI, which also works well in the Hawkular case. As the question came up: that setup also includes the https setup inside WildFly.

The only thing that is a bit problematic in the post is that setting JAVA_OPTS before starting the server will ignore all the settings from standalone.conf, which in the current Hawkular version will prevent a correct start of the bus broker (because the IPv4Only flag is lost).

So in my opinion it is better to modify standalone.conf to *add* those options to the other options that are already there:

  JAVA_OPTS="-Xms64m -Xmx512m -XX:MaxPermSize=256m -Djava.net.preferIPv4Stack=true"
  JAVA_OPTS="$JAVA_OPTS -Xbootclasspath/p:/opt/hawkular-1.0.0.Alpha3-SNAPSHOT/alpn-boot-8.1.3.v20150130.jar"
  JAVA_OPTS="$JAVA_OPTS -Djboss.modules.system.pkgs=$JBOSS_MODULES_SYSTEM_PKGS -Djava.awt.headless=true"

Now when I start the Hawkular server and try to connect with FireFox on the https port, I get the warning about the self signed certificate, but can connect and get the UI over a Http2 connection as described in Greg's post.

Running the OkHttpClient

As said before, the WildFly monitor client is a subsystem inside the WildFly server. I wrote a bit of client code, that is running in the subsystem (shortened):

   OkHttpClient httpClient;
   httpClient = new OkHttpClient();

   // DO NOT USE IN PRODUCTION, allow all hostnames
   httpClient.setHostnameVerifier(new NullHostNameVerifier());

   setKeystore(httpClient); // Use custom ssl factory

   String uri = "https://...:8443/";

   Request request = new Request.Builder()
            .url(uri)
            .addHeader("Accept", "application/json")
            .get()
            .build();

   // sync execution just for the post
   Response resp = httpClient.newCall(request).execute();
   System.out.println(resp.toString());

Fail?

This code works well except for the fact that is always uses Http(s)/1.1 and never Http2 as you can see from the output of the last println statement:

  Response{protocol=http/1.1, code=204, message=....}
I was playing around with various options up to a point where I thought, I have to extract the code to a standalone Java SE class to better debug it in isolation.

I wrote the class, set the bootclasspath, ran it and it worked perfectly:

  Response{protocol=h2, code=204, message=....}

So what is the difference? I removed the bootclasspath setting for ALPN, reran and the connection fell back to http/1.1.

Which is kinda strange as my client subsystem is running inside the very same WilFly server, that is running Undertow and which is able to serve http2 requests and where I added the ALPN classes through JAVA_OPTS earlier.

Now remember that WildFly is using their own classloader system (jboss-modules), which is pretty powerful in isolating deployments and classes and restricting their visibility and/or leakage into areas where they should (not) be seen.

And this in fact is what happened here as well.

Success!

So I had to explicitly add the ALPN classes to my module.xml file for the monitoring client subsystem:

  <module xmlns="urn:jboss:module:1.3" name="${moduleName}">
    <resources>
      <resource-root path="clients-common.jar"/>
      [...]
      <resource-root path="okhttp.jar"/>
      <resource-root path="okio.jar"/>
    </resources>
    <dependencies>
      <!-- modules required by any subsystem -->
      <module name="javax.api"/>
      [...]
      <system export="true">
        <paths>
          <!-- Needed for HTTP2 and SPDY support-->
          <path name="org/eclipse/jetty/alpn"/>
        </paths>
      </system>
    </dependencies>
  </module>

From the above snippet, you can see that the okhttp and okio jars are packaged in the module and are made available to my client code as well.

Now that the module.xml has been adjusted, as is well and my subsystem is using Http2 :-)

Friday, February 06, 2015

Meet the Hawk!

Well, actually that is not Hawk, but HAWKULAR

Hawkular
(Non-official visualization)

Hawkular is the next generation monitoring (and management) project from JBoss incorporating the best features and knowledge from RHQ while at the same time improving on the less strong parts.

Hawkular is composed of a number of individual sub-projects that work together and deliver individual services. The design of those services is in a way that they could also be used standalone in other projects.

The currently most prominent sub-project is Hawkular Metrics, which you probably recall as "RHQ Metrics" and which just has released its version 0.2.7 under the old name. There is also an OpenShift cartridge available for it.

Other sub-projects are:

  • Hawkular-bus: asynchronous bus to connect the various parts. This is a message oriented bus currently running on Active MQ and providing an infrastructure for other projects to re-use.
  • Hawkular-alerts: alerting on incoming metrics (and other events).
  • Hawkular-ui-components: ui components such as Hawt.io 2 plugins and Angular directives that make up the Hawkular Console
  • Hawkular build tools: Helpers and definitions to build Hawkular

Similarly the

  • Wildfly-cassandra extension (run Cassandra 3 as an extension inside WildFly)
  • Wildfly-monitor extension (Monitor WildFly metrics and forward to a Hawkular Metrics instance)

have also been moved over to the Hawkular organization on GitHub

All the pieces are / will be assembled in the Hawkular project

All projects and sub-projects live in GitHub under the Hawkular organization. Right now we have set up the basic projects and other infrastructure. The overall issue tracker is setup at Jboss.org with individual trackers for the sub-projects (you can use the overall tracker and we dispatch).

Right now we are working on getting an end-to-end workflow and integration done for Hawkular.

Development discussions around Hawkular happen on the Hawkular-dev mailing list and you can find the developers hanging around on IRC at irc://irc.freenode.net/#hawkular.

And make sure to follow Hawkular on Twitter

Friday, December 05, 2014

RHQ 4.13 released

I am very pleased to announce the release of RHQ 4.13 as an
early gift from St. Nicholas :)


Screenshot of the RHQ UI showing some charts

This release contains a lot of bug fixes and smaller improvements, as well as some new features:

  • Alerts have a new status 'recovered', that can be filtered upon
  • The UI allows to hide elements that are not needed on a per user basis
  • The as7/WildFly plugin now supports runtime queues and topic subscribers
  • Further improvements in the Storage Nodes

As always RHQ is available for download in form of a zip archive. If you want to try out RHQ without too much setup, you can also use a pre-created Docker image
from https://registry.hub.docker.com/u/rhqproject/rhq-nodb/ (the link contains setup information).

Please consult the release notes for further details and a download link.

Maven artifacts will soon be available on Maven Central.

Special thanks goes to

  • Alan Santos
  • Andreas Veithen
  • Elias Ross
  • JΓ©rΓ©mie Lagarde

for their code contributions for this release.

Friday, October 10, 2014

WildFly subsystem for RHQ Metrics

For RHQ-Metrics I have started writing a subsystem for WildFly 8 that is able to collect metrics inside WildFly and then send them at regular intervals (currently every minute) to a RHQ-Metrics server.


The next graph is a visualization with Grafana of the outcome when this sender was running for 1.5 days in a row:

Graphs of JVM memory usage
Graphs of JVM memory usageWildFly memory usage


( It is interesting to see how the JVM is fine tuning its memory requirement over time and using less and less memory for this constant workload ).


The following is a visualization of the setup:


Setup


The sender is running as a subsystem inside WildFly and reading metrics from the WildFly management api. The gathered metrics are then pushed via REST to RHQ-Metrics. Of course it is possible to send them to a RHQ-Metrics server that is running on a separate host.


The configuration of the subsystem looks like this:

<subsystem xmlns="urn:org.rhq.metrics:wildflySender:1.0">
<rhqm-server
name="localhost"
enabled="true"
port="8080"
token="0x-deaf-beef"/>
<metric name="non-heap"
path="/core-service=platform-mbean/type=memory"
attribute="non-heap-memory-usage"/>
<metric name="thread-count"
path="/core-service=platform-mbean/type=threading"
attribute="thread-count"/>
</subsystem>

As you see, the path to the DMR resource and the name of the attribute to be monitored as metrics can be given in the configuration.


The implementation is still basic at the moment - you can find the source code in the RHQ-Metrics repository on GitHub. Contributions are very welcome.

Heiko Braun and Harald Pehl are currently working on optimizing the scheduling with individual intervals and possible batching of requests for managed servers in a domain.


Many thanks go to Emmanuel Hugonnet, Kabir Khan and especially Tom Cerar for their help to get me going with writing a subsystem, which was pretty tricky for me. The parsers, the object model and the XML had a big tendency to disagree with each other :-)

Sunday, August 24, 2014

Alert definition templates in plugin(descriptor)s ?

Hey,

his is a more general question and not tied to a specific version of RHQ (but may become part of a future version of RHQ and/or RHQ-alerts).

Do you feel it would make sense to provide alert templates inside the plugin (descriptor) to allow the plugin writer to pre-define alert definitions for certain resource types / metrics? Plugin-writers know best what alert definitions and conditions make sense and should get the power to pre-define them.

This idea would probably work best with some relative metrics like disk is 90% full as opposed to absolute values that probably depend a lot more on concrete customer scenarios (e.g. heap usage over 64MB may be good for small installations, but not for large ones).
In the future with RHQ-alerts, it should also be possible to compare two metrics with each other, which will allow to say "if metric(disk usage) > 90% of metric(disk capacity) then ...".

I've scribbled the idea down in the Wintermute page on the RHQ wiki.

If you think this is useful, please respond here or on the wiki page. Best is if you could add a specific example.

Thursday, August 14, 2014

RHQ-Alerts aka Alerts 2.0 aka Wintermute

The RHQ-team has been thinking about next generation Alerting for RHQ for a while.

I have written my thoughts down in a blog post in the RHQ space of the JBoss
community site in order to start the (design) process:

Thoughts on RHQ-Alerts aka Alerts 2.0 aka Wintermute.

Please feel free to comment here or there :)

Tuesday, July 29, 2014

Java Forum Stuttgart 2014

tl;dr: Great as every year.

On July 17th, I attended the Java Forum Stuttgart conference, a one day conference with 49 talks in 7 tracks. This years edition marked a new record with 1600 attendees from all over Germany (and probably also from other countries).

Conference itself was awesome as every year with good talks and good food, 30+ exhibition stands and some free beer at the end :) The conference is organized by the Java User Group Stuttgart e.V. and as such is a non-profit event, which for sure partially explains the success.

I was lucky that my talk "Slim Fast" about a "diet for the application memory footprint" was accepted and I was positively surprised that the room was full despite the fact that the abstract did not contain any buzzwords like IoT or Cloud :-) (German) slides are attached to the above link, JUG Stuttgart now also has posted some pictures.

JUG Stuttgart also posted more pictures of sessions and also some general impression on their G+ page<./p>

Other talks that I've attended were:

"Java FX everywhere" by Gerrit Grunwald, who showed an app that he wrote for the desktop with Java FX and then ported over to devices like Raspberry PI, Android, iPad etc.

"Android ist anders - Android dependency management". This was about dependency management for Android - and for all those that blame Maven hell, check this out and you will like plain Maven afterwards :)

"IBM BlueMix". In this talk a guy from IBM explained a bit what BlueMix is and then demoed creating an app from a simple template and deploying it to a live BlueMix server in the cloud.

"TypeScript - JavaScript fΓΌr Java Entwickler". Kai Toedter showed the TypeScript language as an alternative to JavaScript. While I was a bit skeptical about "yet another language", the talk totally made me change my mind and I can really see it as good alternative for future UI-work.


Sunday, June 15, 2014

RHQ-Metrics and Grafana (updated)

As you may know I am currently working on RHQ-Metrics, a time series database with some charting extensions that will be embeddable into Angular apps.

One of the goals of the project is also to make the database also available for other consumers that may have other input sources deployed as well as their own graphing.

Over the weekend I looked a bit at Grafana which looks quite nice, so I started to combine RHQ-metrics with Grafana.

I did not (immediately) find a description of the data format between Grafana and Graphite, but saw that InfluxDB is supported, so I fired up WireShark and was able to write an endpoint for RHQ-Metrics that supports listing of metrics and retrieving of data.

The overall setup looks like this:

RHQ metrics grafana setup
Setup used

A Ganglia gmond emits data over IP multicast, which is received with the protocol translator client, ptrans. This translates the data into requests that are pushed into the RHQ-metrics system (shown as the dotted box) and there stored in the Cassandra backend.

Grafana then talks to the RHQ-Metrics server and fetches the data to be displayed.
For this to work, I had to comment out the graphiteUrl in conf.js and use the influx backend like this:

 datasources: {
influx: {
default: true,
type: 'influxdb',
username: 'test',
password: 'test',
url: 'http://localhost:8080/rhq-metrics/influx',
}
},

As you can see, the URL points to the RHQ-Metrics server.

The code for the new handler is still "very rough" and thus not yet in the normal source repository. To use it, you can clone my version of the RHQ-Metrics repository and then run start.sh in the root directory to get the RHQ-Metrics server (with the built-in memory backend) running.

Update

I have now added code (still in my repository) to support some of the aggregating functions of Influx like min, max, mean, count and sum. The following shows a chart that uses those functions: