Etoday had pictures of the HK Lego user group implementing Lego-Olympics 2008:
Those are pictures of the Olympic sites built with Lego bricks. Very cool.
Friday, August 29, 2008
Tuesday, August 26, 2008
RHQ: Compiling the apache snmp module on Mac OS X
RHQ and JBossON allow you to monitor Apache servers through its apache plugin. We have official support via precompiled plugins for Linux and Windows and instructions in the JBossON wiki on how to compile this for other Unixoids. While Mac OS X is a Unixoid (under the covers :-), the compile of the snmp module will not directly succeed.
I want to show here how to do that anyway (I did this against apache 2.0.63 from Macports):
Done! :-)
You can now (re)start apache and take it into inventory.
To do this, please specify the root path of the server and the relative path to the htttpd binary, as apache2 from macports is called 'httpd' and not 'apache2', so it won't be correctly detected otherwise.
I want to show here how to do that anyway (I did this against apache 2.0.63 from Macports):
- First, if not yet done install Macports
- Then, install libtool from within macports
sudo port instal libtool - Chdir to
<JON_AGENT_INSTALL_DIR>/product_connectors/apache-snmp/source - Edit the build script (
build_apache_snmp.sh) to replace two occurances oflibtoolizewithglibtoolize - edit snmp_common/ucd-snmp/agent/auto_nlist.c
to include <sys/types.h> : (around line 30)
#include <sys/types.h>
#include "asn1.h"
#include "snmp_api.h" - Run the build as indicated on the build page
- When adding the snmp module config to httpd.conf, specify /var/db for SNMPVar:
SNMPVar /var/db
Done! :-)
You can now (re)start apache and take it into inventory.
To do this, please specify the root path of the server and the relative path to the htttpd binary, as apache2 from macports is called 'httpd' and not 'apache2', so it won't be correctly detected otherwise.
Tuesday, August 19, 2008
Reflection, the complicated way .. :-)
Just found that in some code, had to share this gem:
Ok, not everyone is intimate with reflection and Interpreters often don't care what exact runtime type an object is (as long as you they are assignment compatible), but the effort to call BSH for this is as high as to write some reflection code for it :-) Also pulling in BSH mean for that piece of code to quadruple the binary size ...
Object o = ...;

try {
   bsh.Interpreter i = new bsh.Interpreter();
   i.set("foo",o);
   String bar = i.eval("foo.bar");
}
catch (bsh.EvalError e) {
  ...
}
Ok, not everyone is intimate with reflection and Interpreters often don't care what exact runtime type an object is (as long as you they are assignment compatible), but the effort to call BSH for this is as high as to write some reflection code for it :-) Also pulling in BSH mean for that piece of code to quadruple the binary size ...
Friday, August 15, 2008
RHQ monitor arbitrary JMX servers (Eclipse as example)
While RHQ is focusing on providing specific resource types with specific operations and metrics on them, it is possible to just connect to any JMX server (actually that code is in SVN Head as of today).
This example will show you how you could use this to e.g. monitor your Eclipse instance. This basically consists of two steps:
Add the following to eclipse.ini:
as we don't want for this example password authentication and ssl (of course you should do that for production, but we want to concentrate on how to initiate the connection at all), we disable it by supplying
and restart Eclipse afterwards.
This page at Sun explains the various options for JMX remoting in JDK5.
Go to the inventory tab of the platform and select "Manually Add": "Jmx Server" below the list of child resources. Press OK

On the next screen select "JDK 5" from the drop down and continue:

The following screen will show prefilled connection properties - here we need to set port 10000 from above:
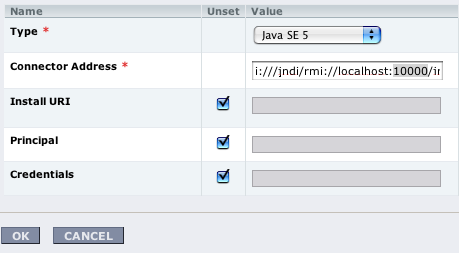
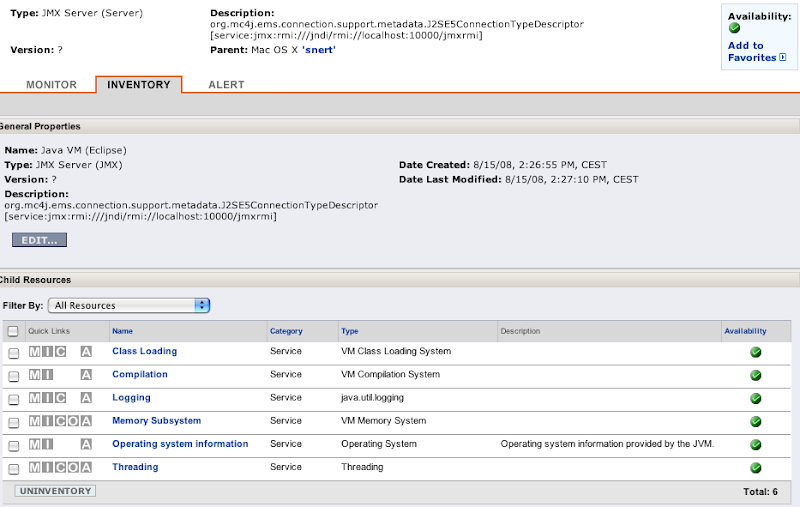
Click on OK and the new Java VM should appear. After some waiting, you will see the inidividual MBeans as you know it from other services in RHQ:
This example will show you how you could use this to e.g. monitor your Eclipse instance. This basically consists of two steps:
- instrument the target app -- Eclipse in this case
- manually add a JMX server to the RHQ inventory
Step 1: instrument Eclipse
Add the following to eclipse.ini:
-Dcom.sun.management.jmxremote

-Dcom.sun.management.jmxremote.port=10000
as we don't want for this example password authentication and ssl (of course you should do that for production, but we want to concentrate on how to initiate the connection at all), we disable it by supplying
-Dcom.sun.management.jmxremote.authenticate=false

-Dcom.sun.management.jmxremote.ssl=false
and restart Eclipse afterwards.
This page at Sun explains the various options for JMX remoting in JDK5.
Step 2: Manually add a JMX server in RHQ
Go to the inventory tab of the platform and select "Manually Add": "Jmx Server" below the list of child resources. Press OK

On the next screen select "JDK 5" from the drop down and continue:

The following screen will show prefilled connection properties - here we need to set port 10000 from above:

Click on OK and the new Java VM should appear. After some waiting, you will see the inidividual MBeans as you know it from other services in RHQ:

RHQ server HA work
We have started to bring High-Availability to the RHQ Server. This is targeted for the upcoming 1.1 release later this year.
The installer has been updated to support HA and in the administration screens you will find a new section on High Availability, that lists the servers in a server cluster:

You can check this out and directly follow it in SVN head.
The installer has been updated to support HA and in the administration screens you will find a new section on High Availability, that lists the servers in a server cluster:

You can check this out and directly follow it in SVN head.
Wednesday, August 13, 2008
New version of iTunes Remote Control (iTRC)
The latest update of iTunes introduced an incompatibility with iTunes Remote Control, so ITRC did no longer work.
James is fortunately providing an updated version of iTRC that fixes the issues.
You can grab v1.4.1 from iTunes Remote Control.
Thanks James!
James is fortunately providing an updated version of iTRC that fixes the issues.
You can grab v1.4.1 from iTunes Remote Control.
Thanks James!
Monday, August 11, 2008
Visit to Legoland
Two weeks ago we've been in Legoland Günzburg, which is around 1.5h away from Stuttgart (by car; Günzburg is also reachable via train).
Parking and entrance was no problem. We had tickets that we ordered over the internet and printed them by ourselves. At the gates, those got just scanned in, so there was no waiting in line.

Behind the entrance Orlando did for the first time not run away from a dog, but even approached it and patted it:

First station was the little express train which does a tour thorough the park which enabled us to get an overview. Unfortunately this has been our first 10 minutes wait on the day with more to come (in total the park was not full and wait times were not too bad).
Next we went through Miniaturland (a landscape with different scenes, all in 1:20 scale). And this really was one of the greatest parts of Legoland. Not only we enjoyed it, but Marlene was totally excited. Whenever she saw a moving car in it, she exclaimed "Da!" ('There') and pointed to it. I think she could have been there for hours.

(Rialto bridge from Venice, Italy)


(Brandenburger Tor, Berlin, Germany)
After this we went to lunch to the Dino-Grill. On the next picture you'll see some typical food here :-)

Otherwise Legoland featured some wild animals:


Knights on their horses:

Driving schools:

And a lot of other tourists:

The kids really liked the visit to Legoland and Orlando is very willing to go there soon again. Actually as he was rejected at two places for being to small, he is even now drinking milk to accelerate his height growth.
Parking and entrance was no problem. We had tickets that we ordered over the internet and printed them by ourselves. At the gates, those got just scanned in, so there was no waiting in line.

Behind the entrance Orlando did for the first time not run away from a dog, but even approached it and patted it:

First station was the little express train which does a tour thorough the park which enabled us to get an overview. Unfortunately this has been our first 10 minutes wait on the day with more to come (in total the park was not full and wait times were not too bad).
Next we went through Miniaturland (a landscape with different scenes, all in 1:20 scale). And this really was one of the greatest parts of Legoland. Not only we enjoyed it, but Marlene was totally excited. Whenever she saw a moving car in it, she exclaimed "Da!" ('There') and pointed to it. I think she could have been there for hours.

(Rialto bridge from Venice, Italy)


(Brandenburger Tor, Berlin, Germany)
After this we went to lunch to the Dino-Grill. On the next picture you'll see some typical food here :-)

Otherwise Legoland featured some wild animals:


Knights on their horses:

Driving schools:

And a lot of other tourists:

The kids really liked the visit to Legoland and Orlando is very willing to go there soon again. Actually as he was rejected at two places for being to small, he is even now drinking milk to accelerate his height growth.
Thursday, August 07, 2008
Don't be afraid to use a profiler
While developing on RHQ I encountered several situations where things were slow. One starts to look at the code, add a few print statements here and there and tries to guess what it happening.
Running the whole show through a debugger usually also doesn't help as digging deep into method calls will let you run into transaction timeouts from which point on, results are just useless.
Luckily there is a different sort of debugging help: Profilers like jProfiler from ej-technology, the one built into NetBeans, TPTP in Eclipse and others.
Profilers like jProfiler give you a few different ways to look at your application. For this discussion about performance, I will concentrate on the cpu usage part, as this is the most relevant for our case.
But actually (and this is what my presentation at Java Forum Stuttgart was about) they also make very nice debugging helpers.
Before I dive deeper into the subject, I want to give a sort differentiation between profiler and debugger.
If the application code you want to step through is large, you will most likely run into transaction timeouts, which renders all results invalid.
Suppose you want to participate in RHQ and ask yourself "what happens if I click here?"
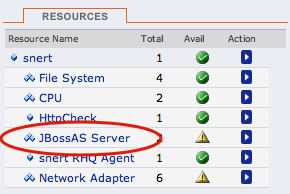
With a debugger this is hard do tell. You could search through the code for this string. And then try to find out if this is a Struts-page or a JSF page or you could look at where this link is pointing to and try to determine the resulting page from this.
With a profiler the steps could be as follows:
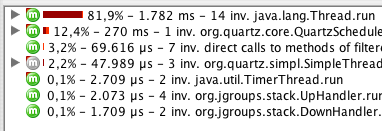
Generally open the node with the most CPU usage (Thread.run, the top line here).
This will give a subtree view like this:

Here we see that the CPU time is spent in 3 invocations of some

And we see that those 3 invocations are actually 3 individual Struts actions. From here on it is easy to dive into them by either just opening the tree nodes again or by looking them up in
Now that you know where time is spent, you want to improve the methods. Always going from the top can be tiring. Most profilers allow you to limit the display to just one method and its children.
Also its possible (at least with JProfiler) to add a trigger, that fires and starts profiling when a certain method is called and stops when the path of execution leaves this method again.
Running the whole show through a debugger usually also doesn't help as digging deep into method calls will let you run into transaction timeouts from which point on, results are just useless.
Luckily there is a different sort of debugging help: Profilers like jProfiler from ej-technology, the one built into NetBeans, TPTP in Eclipse and others.
Profilers like jProfiler give you a few different ways to look at your application. For this discussion about performance, I will concentrate on the cpu usage part, as this is the most relevant for our case.
But actually (and this is what my presentation at Java Forum Stuttgart was about) they also make very nice debugging helpers.
Differentiation Profiler vs. Debugger
Before I dive deeper into the subject, I want to give a sort differentiation between profiler and debugger.
Debugger
- Stepping through individual statements of the code
- Stops the execution, so not for production use
- Allows to see the content of individual variables
- Hard to see the root cause of slowness, as this might be deep down in used libraries.
If the application code you want to step through is large, you will most likely run into transaction timeouts, which renders all results invalid.
Profiler
- Application runs normally (but slower)
- No way to see individual variable content
- Easy way to get call graphs through the application
How to tackle the issues
Suppose you want to participate in RHQ and ask yourself "what happens if I click here?"

With a debugger this is hard do tell. You could search through the code for this string. And then try to find out if this is a Struts-page or a JSF page or you could look at where this link is pointing to and try to determine the resulting page from this.
With a profiler the steps could be as follows:
- Instrument the RHQ server with in a profiler specific way (have a look at the profiler vendors manual)
- Start the application and navigate to the above page
- Start the profiler and start profiling CPU usage
- Click on the link
- When the result page is rendered, stop CPU profiling
- Start looking at the timing tree as outlined below

Generally open the node with the most CPU usage (Thread.run, the top line here).
This will give a subtree view like this:

Here we see that the CPU time is spent in 3 invocations of some
org.rhq.enterprise.* method and also in 4 calls to a HighLowChart. Here we are interested in the org.rhq code, so we open this subtree:
And we see that those 3 invocations are actually 3 individual Struts actions. From here on it is easy to dive into them by either just opening the tree nodes again or by looking them up in
struts-config.xmlRepeated invocations
Now that you know where time is spent, you want to improve the methods. Always going from the top can be tiring. Most profilers allow you to limit the display to just one method and its children.
Also its possible (at least with JProfiler) to add a trigger, that fires and starts profiling when a certain method is called and stops when the path of execution leaves this method again.
RHQ - tip of the day: Agent waiting at startup
Sometimes when you start the RHQ agent (on commandline), it will not proceed to the
Well, this message from the agent actually goes on:
This means that the connecting agent is known as 'snert' to the server, but it was passing a different name to it on this start.
To solve this, start the agent with option
By default (well, you had to answer the questions on about it), the communication ports for server-agent communication are as follows (yes, two unidirectional connections):
This is an agent state where the server can not be reached (perhaps because it is down or because a firewall blocks the traffic.
So make sure port 7080 on the server machine is reachable from the agents machine. You can simply do this with a web browser like Safari or lynx or wget.
Here, after a little time the agent will show a message like this:
This means that the agent was able to talk to the server (so this communication channel is ok), but
the other direction is failing. In the example above, the server was trying to reach an agent on IP 172.31.7.3 and TCP port 12345, which was probably blocked in the firewall.
This usually means that the server has a different security token than the one the agent was sending.
This could come from the fact that the java preferences entry got mangled e.g by testing with different agent versions or VMs or ...
You will see this message only on initial agent startup when it does not have any plugins yet.
If plugins got downloaded in a previous run, you will probably run in the situation shown below.
If you see this on the agent, you should also see messages like this on the server side:
To solve this, start the agent interactively with the
Here, the agent successfully starts, but you will e.g not see any new metric data coming in from this agent. When you give the ping command on the agent command line you will see something like:
This is basically the same as above. Your server log should also be full of those
sending> prompt, but sit there and wait for something. This post will talk about some of the possibilities.The server has rejected the agent registration request...
Well, this message from the agent actually goes on:
Cause: [org.rhq.core.clientapi.server.core.AgentRegistrationException:The agent asking for registration is trying to register the same address/port [172.31.7.7:16163] that is already registered under a different name [snert]; if this new agent is actually the same as the original, then re-register with the same name]
This means that the connecting agent is known as 'snert' to the server, but it was passing a different name to it on this start.
To solve this, start the agent with option
--clean and give the correct name.The agent will now wait until it has registered with the server...
By default (well, you had to answer the questions on about it), the communication ports for server-agent communication are as follows (yes, two unidirectional connections):
- Agent to server: server is listening on port 7080
- Server to agent: the agent is listening on port 16163
... and hangs there
This is an agent state where the server can not be reached (perhaps because it is down or because a firewall blocks the traffic.
So make sure port 7080 on the server machine is reachable from the agents machine. You can simply do this with a web browser like Safari or lynx or wget.
... and shows an additional error
Here, after a little time the agent will show a message like this:
The server has rejected the agent registration request. Cause: [org.rhq.core.clientapi.server.core.AgentRegistrationException:Server cannot ping the agent's endpoint. The agent's endpoint is probably invalid or there is a firewall preventing the server from connecting to the agent. Endpoint: socket://172.31.7.3:12345/....This means that the agent was able to talk to the server (so this communication channel is ok), but
the other direction is failing. In the example above, the server was trying to reach an agent on IP 172.31.7.3 and TCP port 12345, which was probably blocked in the firewall.
The agent does not have plugins - it will now wait for them to be downloaded...
This usually means that the server has a different security token than the one the agent was sending.
This could come from the fact that the java preferences entry got mangled e.g by testing with different agent versions or VMs or ...
You will see this message only on initial agent startup when it does not have any plugins yet.
If plugins got downloaded in a previous run, you will probably run in the situation shown below.
If you see this on the agent, you should also see messages like this on the server side:
11:40:48,454 WARN [CommandProcessor] {CommandProcessor.failed-authentication}Command failed to be authenticated! This command will be ignored and not processed: Command: type=[remotepojo]; cmd-in-response=[false]; config=[{rhq.security-token=1217855913569-109582636-403140853869881172, rhq.send-throttle=true}]; params=[{targetInterfaceName=org.rhq.core.clientapi.server.core.CoreServerService, invocation=NameBasedInvocation[getLatestPlugins]}]To solve this, start the agent interactively with the
--clean option.Agent startup is ok, but ping command fails
Here, the agent successfully starts, but you will e.g not see any new metric data coming in from this agent. When you give the ping command on the agent command line you will see something like:
sending> ping

Pinging...

Failed to execute prompt command [ping]. Cause: org.rhq.enterprise.communications.command.server.AuthenticationException:Command failed to be authenticated!  This command will be ignored and not processed: Command: type=[remotepojo]; cmd-in-response=[false]; config=[{rhq.security-token=1214208960346-102975580-7334156733284942657, rhq.send-throttle=true}]; params=[{targetInterfaceName=org.rhq.enterprise.communications.Ping, invocation=NameBasedInvocation[ping]}]
This is basically the same as above. Your server log should also be full of those
CommandProcessor.failed-authentication messages. Solution as in the previous section.Monday, August 04, 2008
NanoMaps for Mobiles | Features | TrailRunner
Wolfgang picked up my "how to" to import the Nano maps into phones like the K610i. You can find the entry here:
NanoMaps for Mobiles | Features | TrailRunner
Saturday, August 02, 2008
Subscribe to:
Comments (Atom)


