Running the whole show through a debugger usually also doesn't help as digging deep into method calls will let you run into transaction timeouts from which point on, results are just useless.
Luckily there is a different sort of debugging help: Profilers like jProfiler from ej-technology, the one built into NetBeans, TPTP in Eclipse and others.
Profilers like jProfiler give you a few different ways to look at your application. For this discussion about performance, I will concentrate on the cpu usage part, as this is the most relevant for our case.
But actually (and this is what my presentation at Java Forum Stuttgart was about) they also make very nice debugging helpers.
Differentiation Profiler vs. Debugger
Before I dive deeper into the subject, I want to give a sort differentiation between profiler and debugger.
Debugger
- Stepping through individual statements of the code
- Stops the execution, so not for production use
- Allows to see the content of individual variables
- Hard to see the root cause of slowness, as this might be deep down in used libraries.
If the application code you want to step through is large, you will most likely run into transaction timeouts, which renders all results invalid.
Profiler
- Application runs normally (but slower)
- No way to see individual variable content
- Easy way to get call graphs through the application
How to tackle the issues
Suppose you want to participate in RHQ and ask yourself "what happens if I click here?"

With a debugger this is hard do tell. You could search through the code for this string. And then try to find out if this is a Struts-page or a JSF page or you could look at where this link is pointing to and try to determine the resulting page from this.
With a profiler the steps could be as follows:
- Instrument the RHQ server with in a profiler specific way (have a look at the profiler vendors manual)
- Start the application and navigate to the above page
- Start the profiler and start profiling CPU usage
- Click on the link
- When the result page is rendered, stop CPU profiling
- Start looking at the timing tree as outlined below

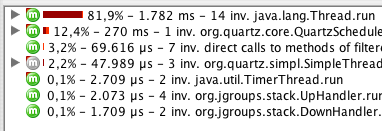
Generally open the node with the most CPU usage (Thread.run, the top line here).
This will give a subtree view like this:

Here we see that the CPU time is spent in 3 invocations of some
org.rhq.enterprise.* method and also in 4 calls to a HighLowChart. Here we are interested in the org.rhq code, so we open this subtree:
And we see that those 3 invocations are actually 3 individual Struts actions. From here on it is easy to dive into them by either just opening the tree nodes again or by looking them up in
struts-config.xmlRepeated invocations
Now that you know where time is spent, you want to improve the methods. Always going from the top can be tiring. Most profilers allow you to limit the display to just one method and its children.
Also its possible (at least with JProfiler) to add a trigger, that fires and starts profiling when a certain method is called and stops when the path of execution leaves this method again.
No comments:
Post a Comment